David Taylor, UX Researcher
Microsoft
Cafe Ontology
Find a Table
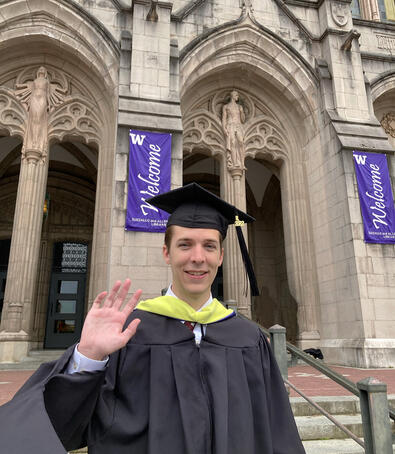
David Taylor is a recent graduate of the prestigious University of Washington's School of Information, where he honed his expertise in leveraging design thinking to solve complex user experience challenges. With a profound commitment to qualitative research, David is dedicated to unraveling the intricacies of the user journey to craft meaningful and humane technological experiences.David holds a Master of Science in Information Management, further complemented by a Bachelor of Arts in Communications from Brigham Young University. During his undergraduate years, he actively contributed to the university's success by participating in national advertising campaigns, showcasing his knack for creativity and strategic communication as a member of the award-winning BYU Adlab.David's impressive portfolio extends beyond academia. He boasts four semesters and two summers of hands-on experience in print production at his weekly college newspaper, demonstrating a keen eye for detail and commitment to delivering high-quality work. His talents also found a home at The Walt Disney Company headquarters, where he spent a summer designing internal emergency preparedness materials, exemplifying his adaptability and problem-solving skills.Further enriching his skill set, David dedicated another summer to conducting user interviews at the tech giant, Microsoft, as part of his graduate coursework. This experience provided valuable insights into user-centric design and solidified his reputation as a thorough researcher and empathetic practitioner.David Taylor is, in his own words, a "pragmatic creative." He draws inspiration from the ordinary patterns of life, constantly seeking innovative solutions to everyday challenges. Beyond his professional pursuits, David maintains a vibrant presence in the digital realm, where he indulges his passion for blogging and actively participates in local hackathons. His fascination with information architecture even extends to the whimsical world of Pokémon.Notably, David is an avid archivist of home videos, cherishing memories and documenting life's journeys. His core values revolve around the pillars of learning, innovation, and humor, which he seamlessly incorporates into his work and personal life.In his own words, David offers a guiding philosophy: "Trust the process, stay curious, and fail fast!" These words reflect his commitment to growth, curiosity, and a resilient spirit in the face of challenges.
Additional information:
Email Address ⎪Resume ⎪Newsletter⎪Pokemon Colors
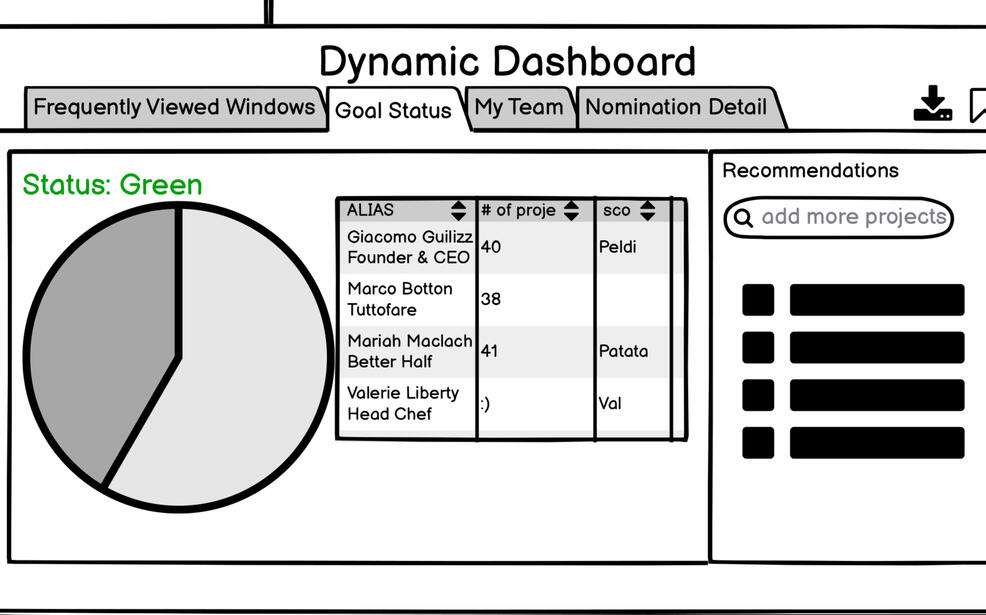
Microsoft: Improving Power BI Manager Reports
SPONSORED RESEARCH PRACTICUMProblem: In 2020, a Power BI app was released for the managers in FastTrack for Azure with the purpose of enabling leads to view their team's statuses in a holistic way. However, report adoption is low and managers prefer to use the reports that are better framed for the individual contributor.
Process:
Weeks 1-2: Understand the domain
Meet with sponsors twice a week, review documentation, access training assets and Microsoft research methodologies.Weeks 3-6: Conduct user interviews
Identify stakeholders, write interview questions, recruit interviewees, schedule 8 interviews across 5 time zones, interview stakeholders with interviewer and notetaker.Week 7: Analyze
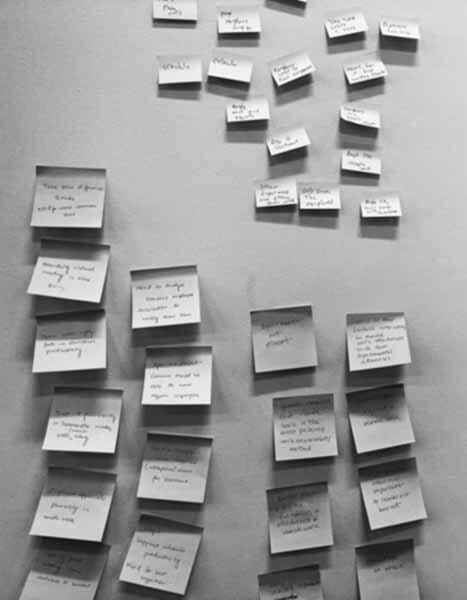
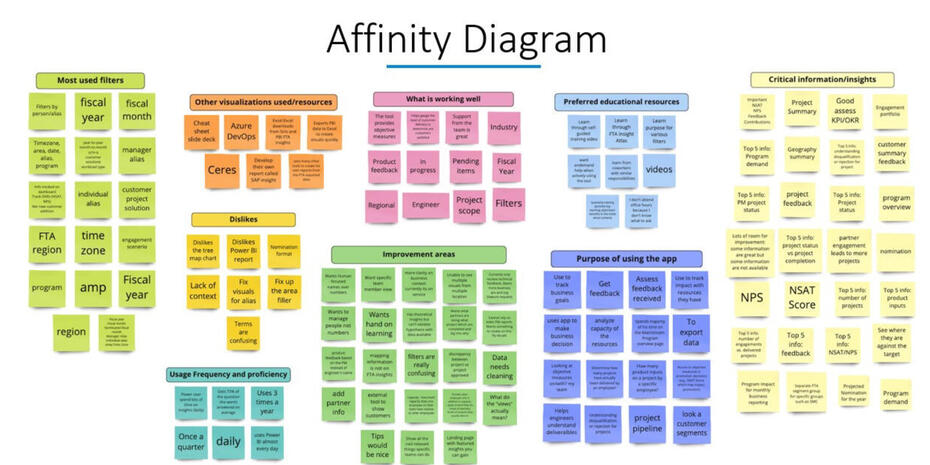
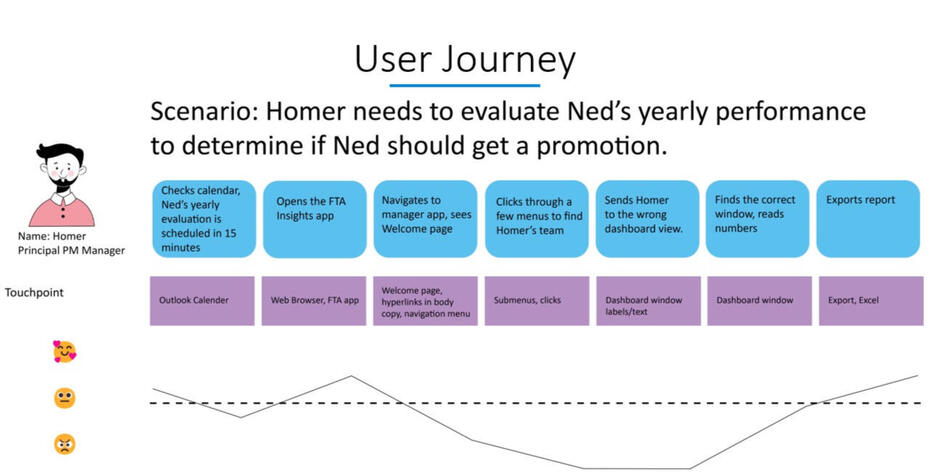
Synthesize findings using affinity diagram and qualitative code book. Identify themes in strengths, user pain points, and assumptions. Develop personas, define the customer journey map. Essentially understand what the user values.Week 8: Prototype
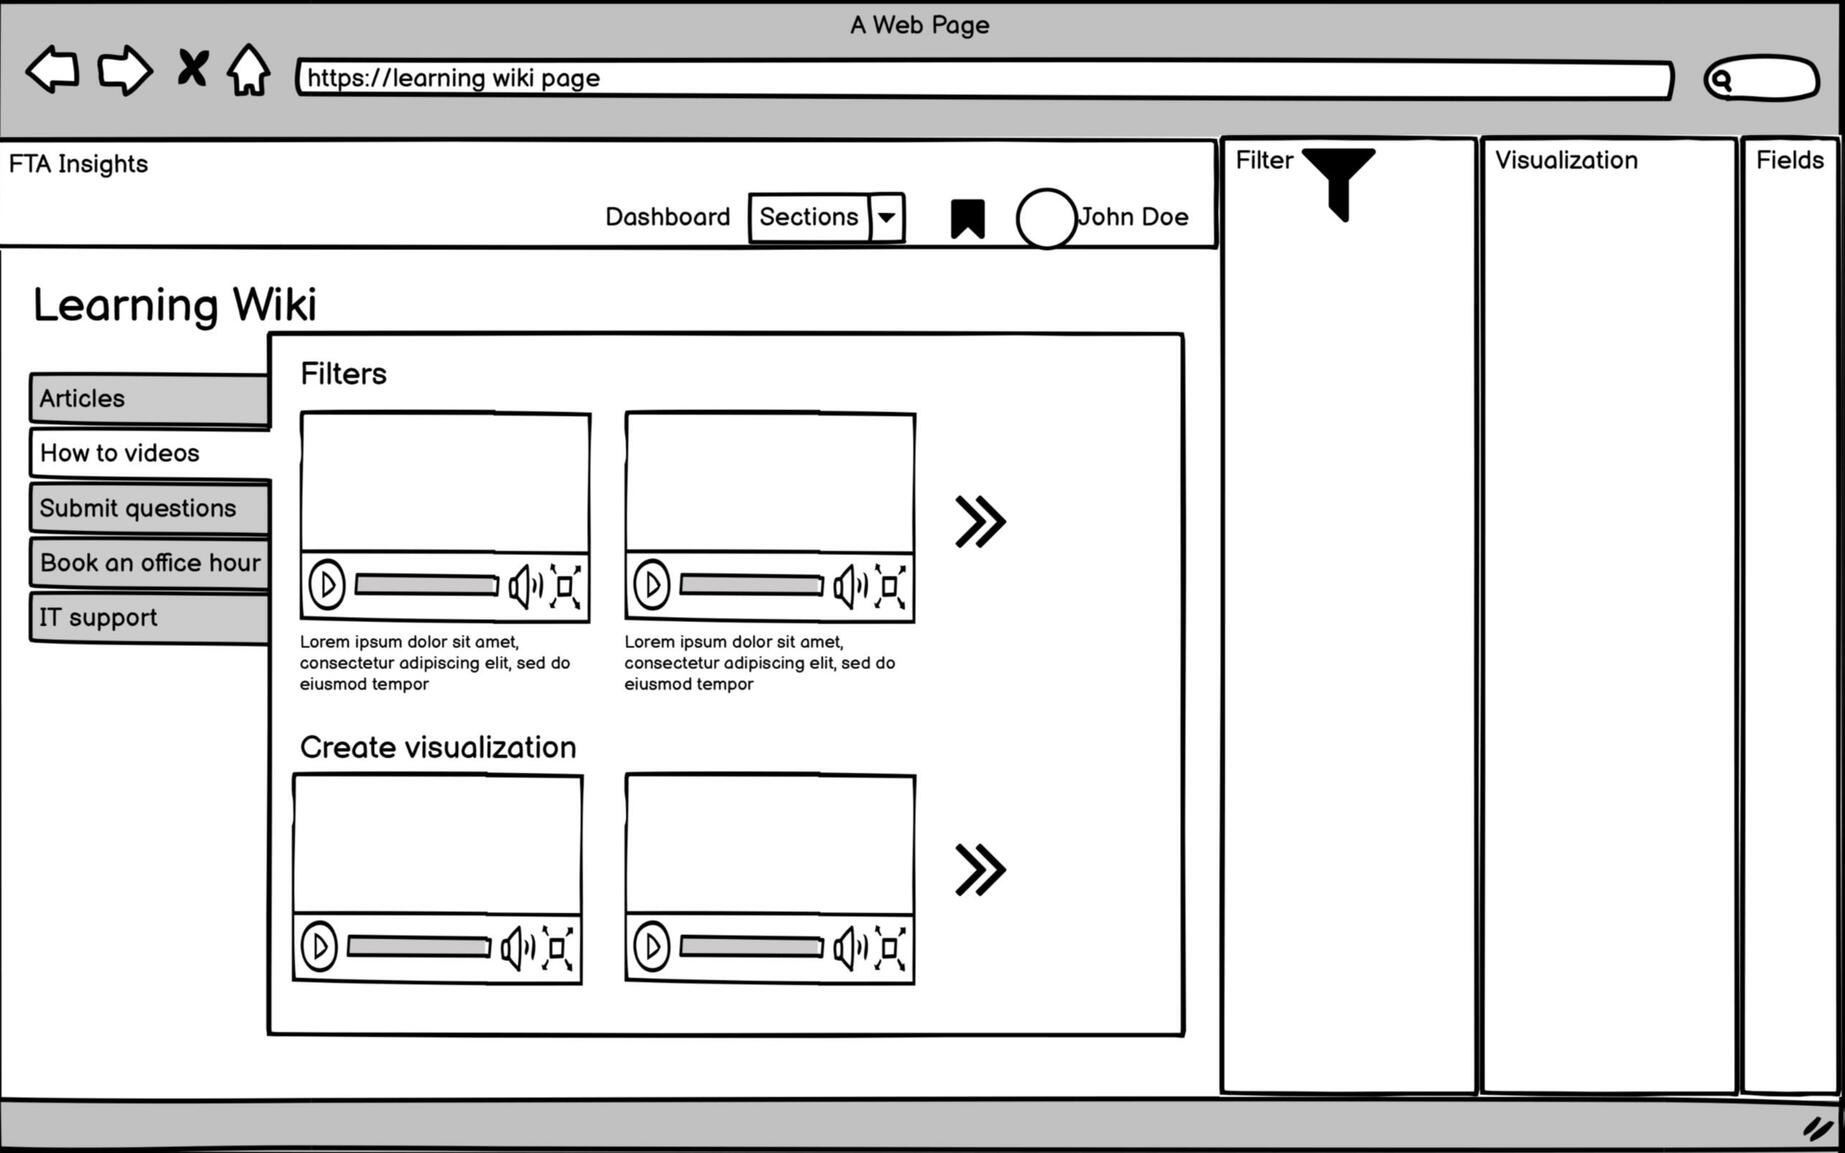
Conduct structured brainstorming session, make paper and whiteboard wireframes, review and iterate, create low fidelity Balsamiq prototype, review and iterate, create Figma prototype, review and iterate, present to stakeholders.
My role: Scheduled interviews with stakeholders, wrote interview questions, conducted user interviews, took notes during interviews, built affinity diagram, wrote personas, made user journey map, developed low-fidelity prototype, presented, made the case study websiteResult:
Met with Microsoft leadership and presented recommendations aimed to enhance the information architecture, prioritize learning, and adapt to user preferences.
View the full case study here
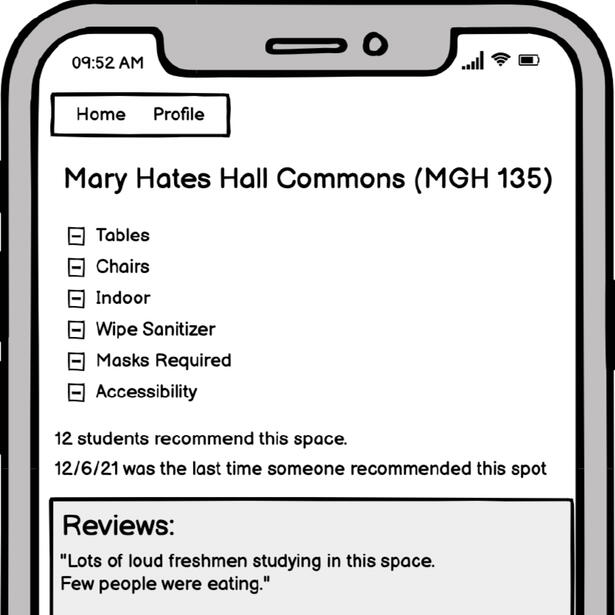
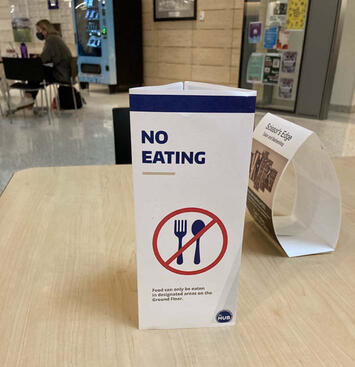
Find a Table: Finding Comfort in Public Eating Spaces During COVID-19
Problem: Covid-19 has led to new indoor eating guidelines for students on-campus. People don’t feel comfortable in crowded indoor spaces unmasked.
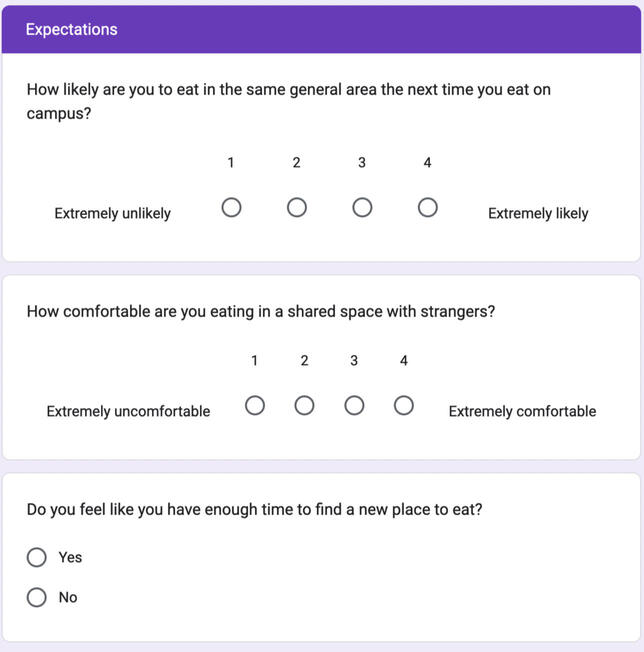
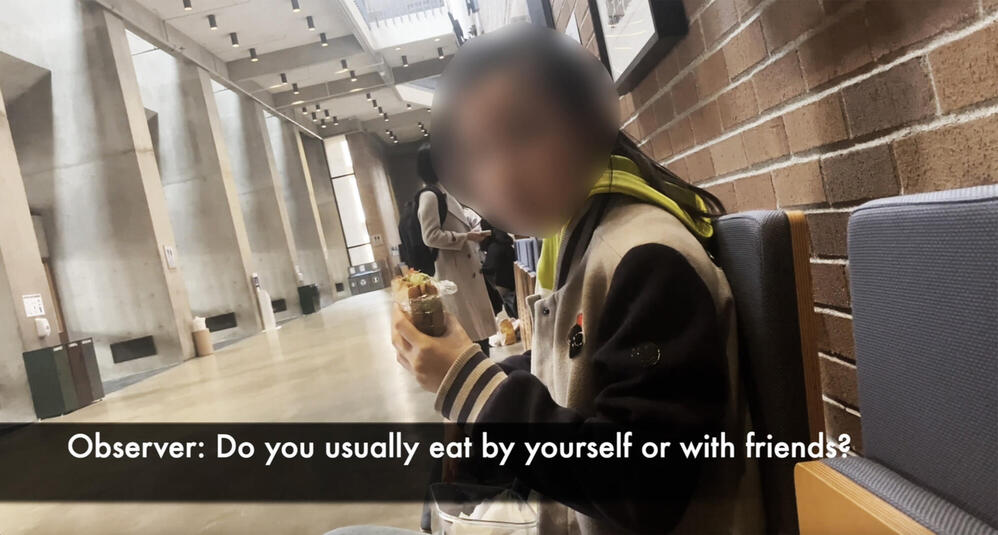
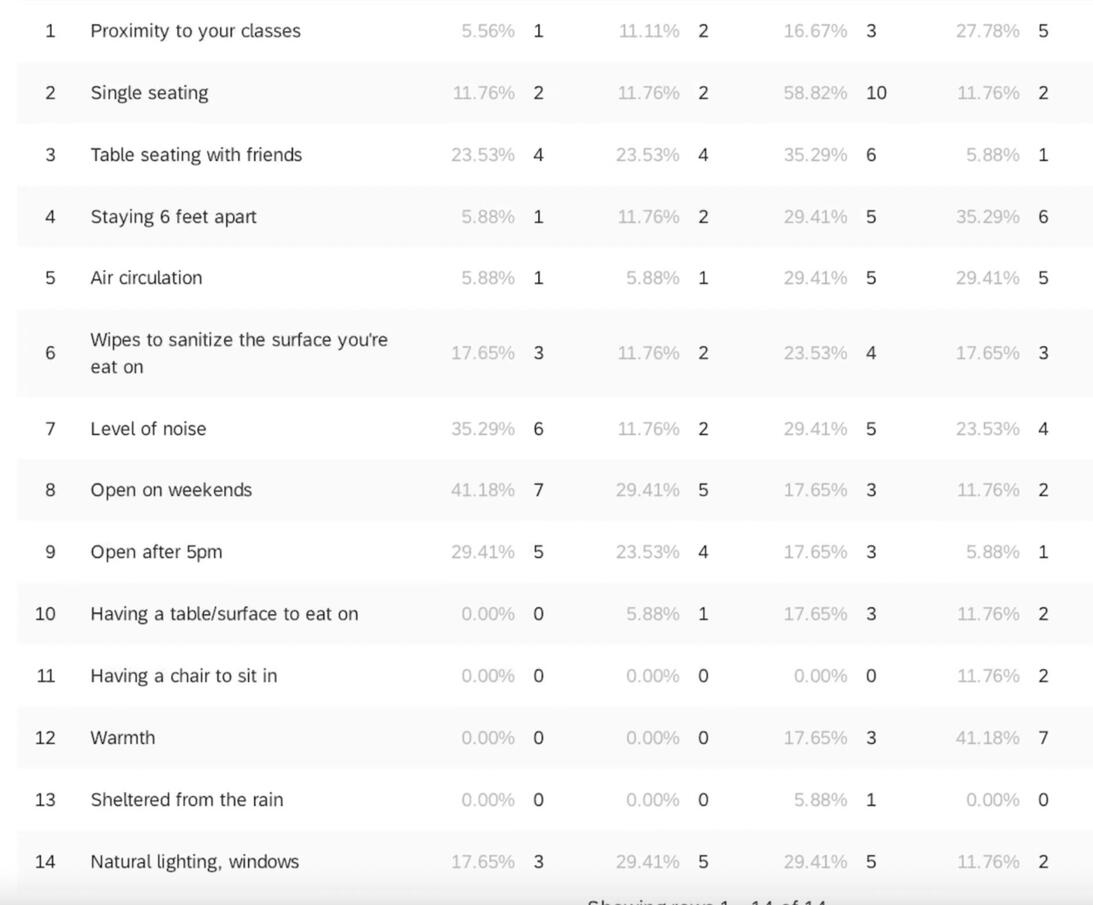
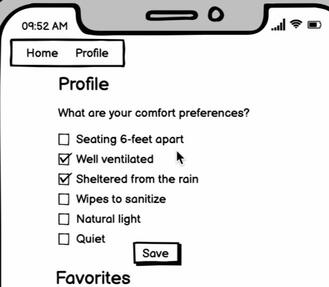
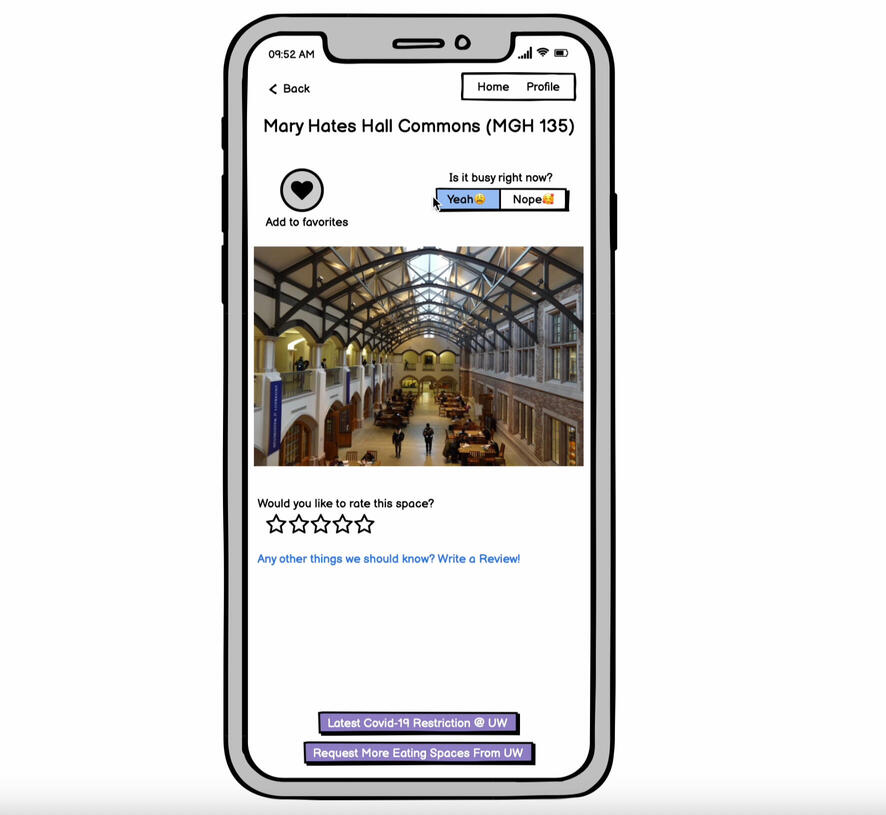
Process: We first created a list of stakeholders affected by eating on campus. We then built a system diagram and identified 5 individuals to conduct contextual inquiries on. Afterwards we sent out a Qualtrics survey to 20 additional stakeholders to better understand comfort dimensions in a public eating space. We then built a prototype, performed a Wizard of Oz usability test, then iterated on the design.
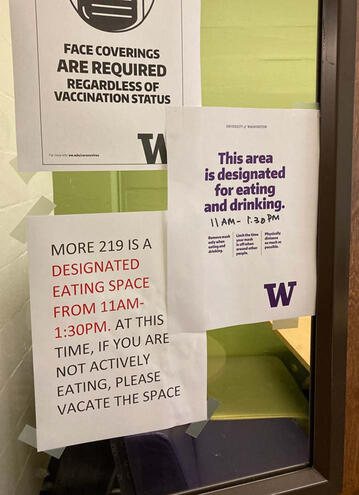
Proposal: We propose that if the issue of crowded, indoor, unmasked, eating spaces was addressed, students would be more comfortable eating on campus and be more compliant with safety regulations. However, we recognize that raising awareness of designated eating locations may make those spaces and other dining locations more crowded, potentially impacting the infection rate while also reducing the number of quiet, secluded spaces on campus
Learning About Taxonomies and Ontologies by Enhancing a Keto Diet Menu.
Problem: Using publicly-available data, create a user search interface prototype to recommend low-carb food options to regular cafe customers.Approach: The primary goal of our approach was to imagine how a low-carb solution would look in the real world. To do this, we had to build the underlying information architecture:
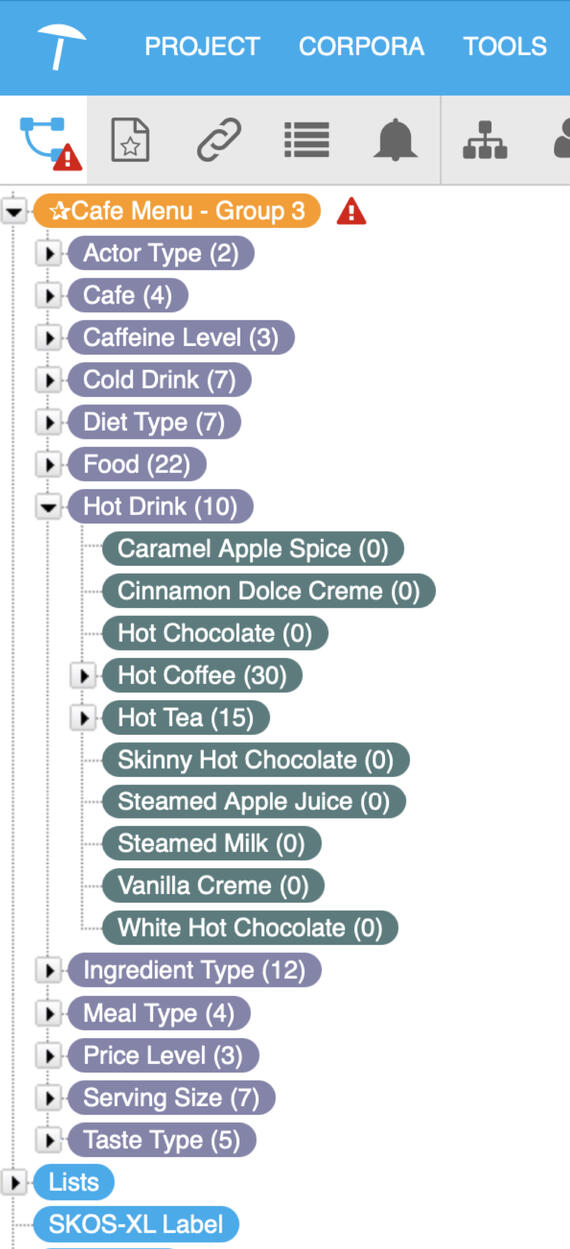
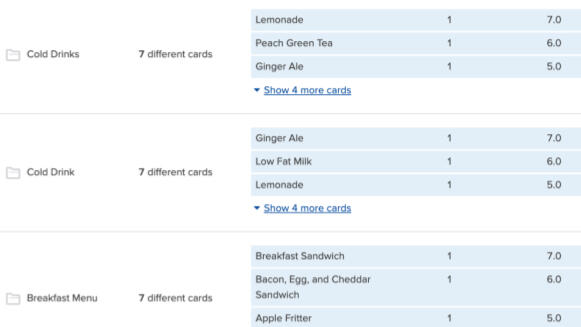
Start with a taxonomy
We constructed our cafe menu taxonomy in PoolParty. Our approach was to create a taxonomy that referenced cafes that people were familiar with and around us. We used Starbucks as the primary resource as it was one of the few cafes that included detailed nutritional facts. To expand the concept terms in our taxonomy, we reviewed other cafe menus such as Caribou Coffee, Dunkin Donuts, and Peet's Coffee. The first level concept terms included cold drinks, food, hot drinks, ingredient type, and diet type. In addition to expanding our taxonomy, we used corpus analysis in PoolParty to help us extract more concept terms from all the cafe menus. We pulled data from a Kaggle dataset that included every Starbucks menu item to provide us with additional candidate terms for our taxonomy. We also ran a web crawl on various menus from the official websites of Starbucks, Caribou Coffee, Peet’s Coffee, Coffee Bean, Einstein Bagels, and the DBpedia entry for “low-carbohydrate diet”.
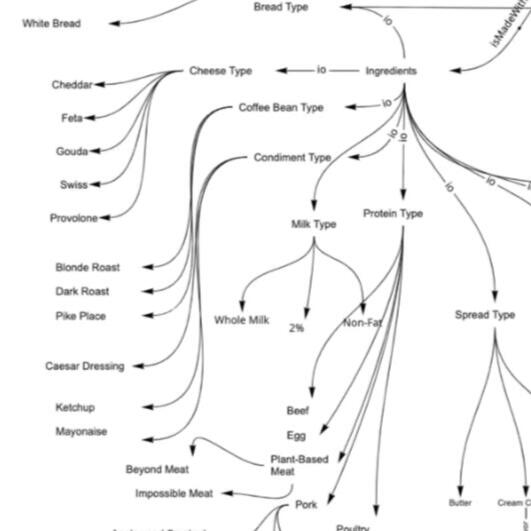
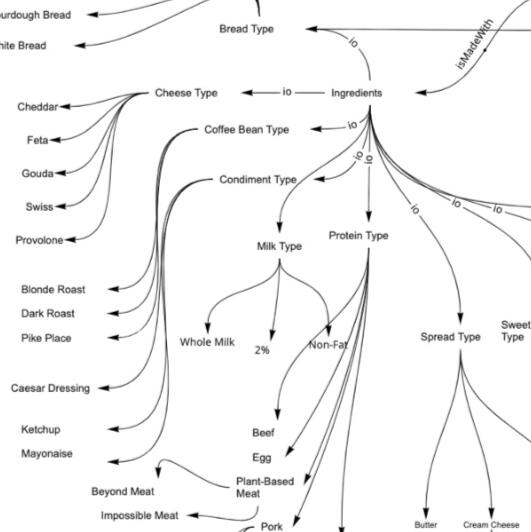
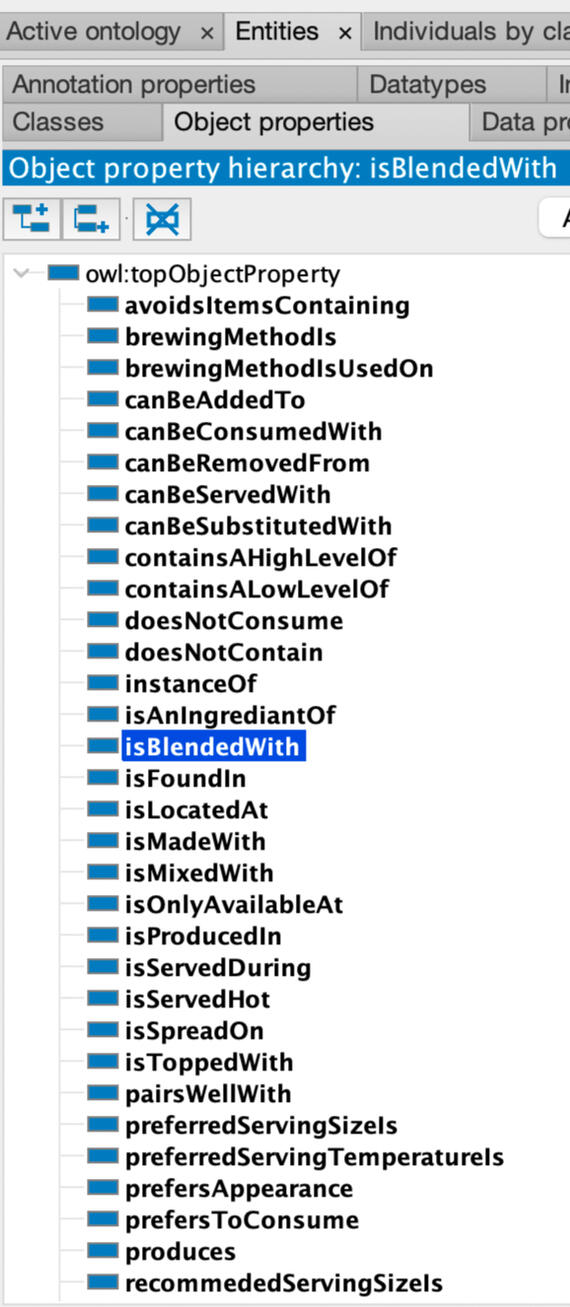
Add an ontology
Building off our taxonomy, our ontology goes one step further in showing more relationships in a non-hierarchical setting. We realized we needed to add more classes to better understand our use scenario so we added new classes to our taxonomy such as “Meal Type” and “Diet Type” to show more relationships. When building out our relationships we needed to think about our user journey. What would our users care about? In a spreadsheet we wrote down various relationship terms which needed to relate to at least one other class in our taxonomy. To help describe how a user may search for an item we created the relationship “isServedDuring” to pair, for example “bagel” with “breakfast”. We want our optimized cafe menu app to recommend items based on a variety of variables such as the meal and diet types. Another relationship we included was ingredient types of various food and drinks.Building out our attributes we again thought about our use case and what information would be useful to not only the app user but also the administrator. Some would obviously be more beneficial to the user such as “Address”, “Allergen”, and “Phone Number” but others could serve both the user and the administrator like “Price” and “Order Number”. We then created a custom schema with specific limits on the domain and range for each class. We knew it wouldn’t be efficient to always include the relationship “isServedDuring” for every class so we only permitted that relationship to occur in our domain of “Consumables” and our range “Meal”.
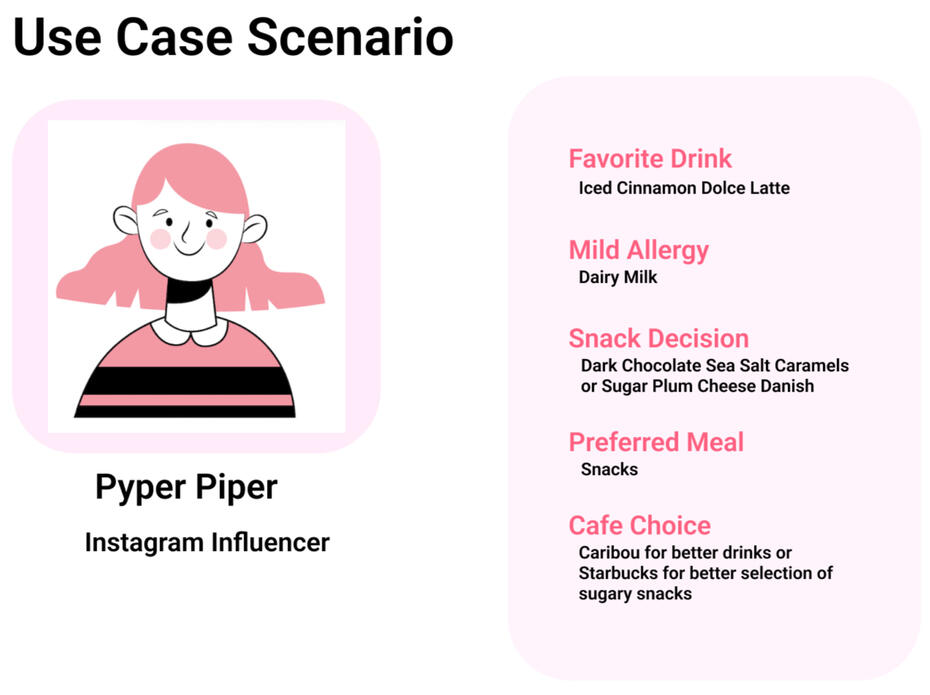
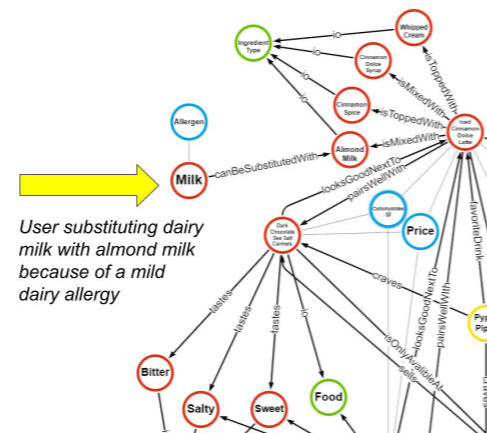
Understand the user
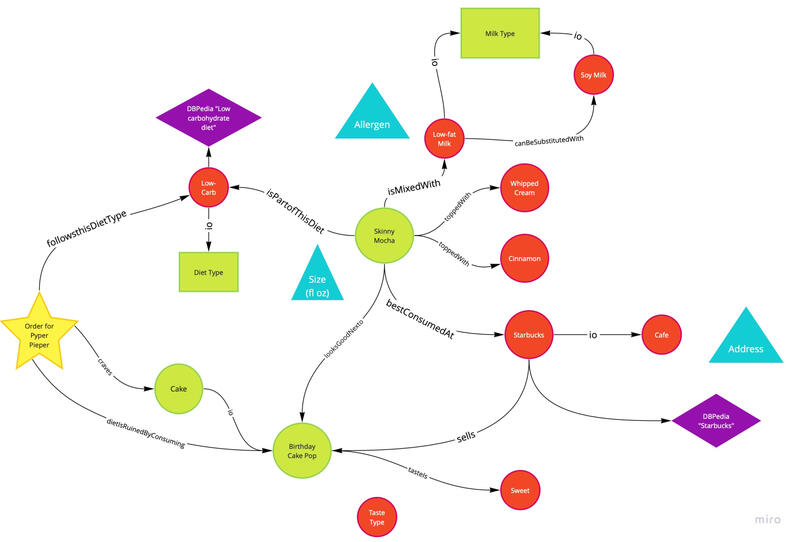
A knowledge graph shows the relationships of interlinked entities that develop further insight or knowledge on the data given. In our use case scenario, Pyper Pieper is an Instagram influencer and is ending her week with a given choice of a cheat day as she has been on a strict low-carb diet throughout the week. We visually displayed relationships between Pyper Piper, her situation, objects, concepts, and events using a knowledge graph.In exploring the scenario we discovered optimal ways to implement the relationships between our user, her needs and restrictions. Her favorite drink is the iced cinnamon dolce latte from Starbucks, a concept from the Cafe domain in the taxonomy. We utilized the “favoriteDrink” relationship in the ontology to link the two together. She usually replaces the dairy milk with an alternative milk because of a mild dairy allergy. We implemented the allergen attribute from the ontology to understand why she is making the substitution of dairy milk with almond milk.Each of her possible decisions and motivations helped build our ontological relationships and the knowledge graph to represent these relationships. Pyper Piper’s scenario is one example of a single user's decision-making process. But through that we have access to a host of our other classes and provides us the ability to expand and enhance current and future users' experiences.
Impact
We created a taxonomy and associated ontology with a specific goal in mind - to help individuals on a low-carb diet identify appropriate food and drinks at popular café chains. As a result, users on a strict low carb diet would be most impacted by our solution. However, due to the underlying logic and information architecture, we believe our solution could be expanded to fit the needs of a variety of diets including gluten-free, vegan, vegetarian, kosher, and halal among others.Another major aspect our team considered when building our information structure was the ability to provide accurate recommendations. To do this, we opted to create broader domains which would allow us to create finer and potentially more valuable relationships that could inform recommendations. This process would subsequently make dieting more accessible for busy individuals.
If our approach was adopted, the most emphasis would be placed on bolstering the relationships found in the ontology and the logic behind the knowledge graph to inform the recommendations seen on the app. This would create the best possible user experience because the user would be able to find the most appropriate suggestions for his or her needs and preferences.